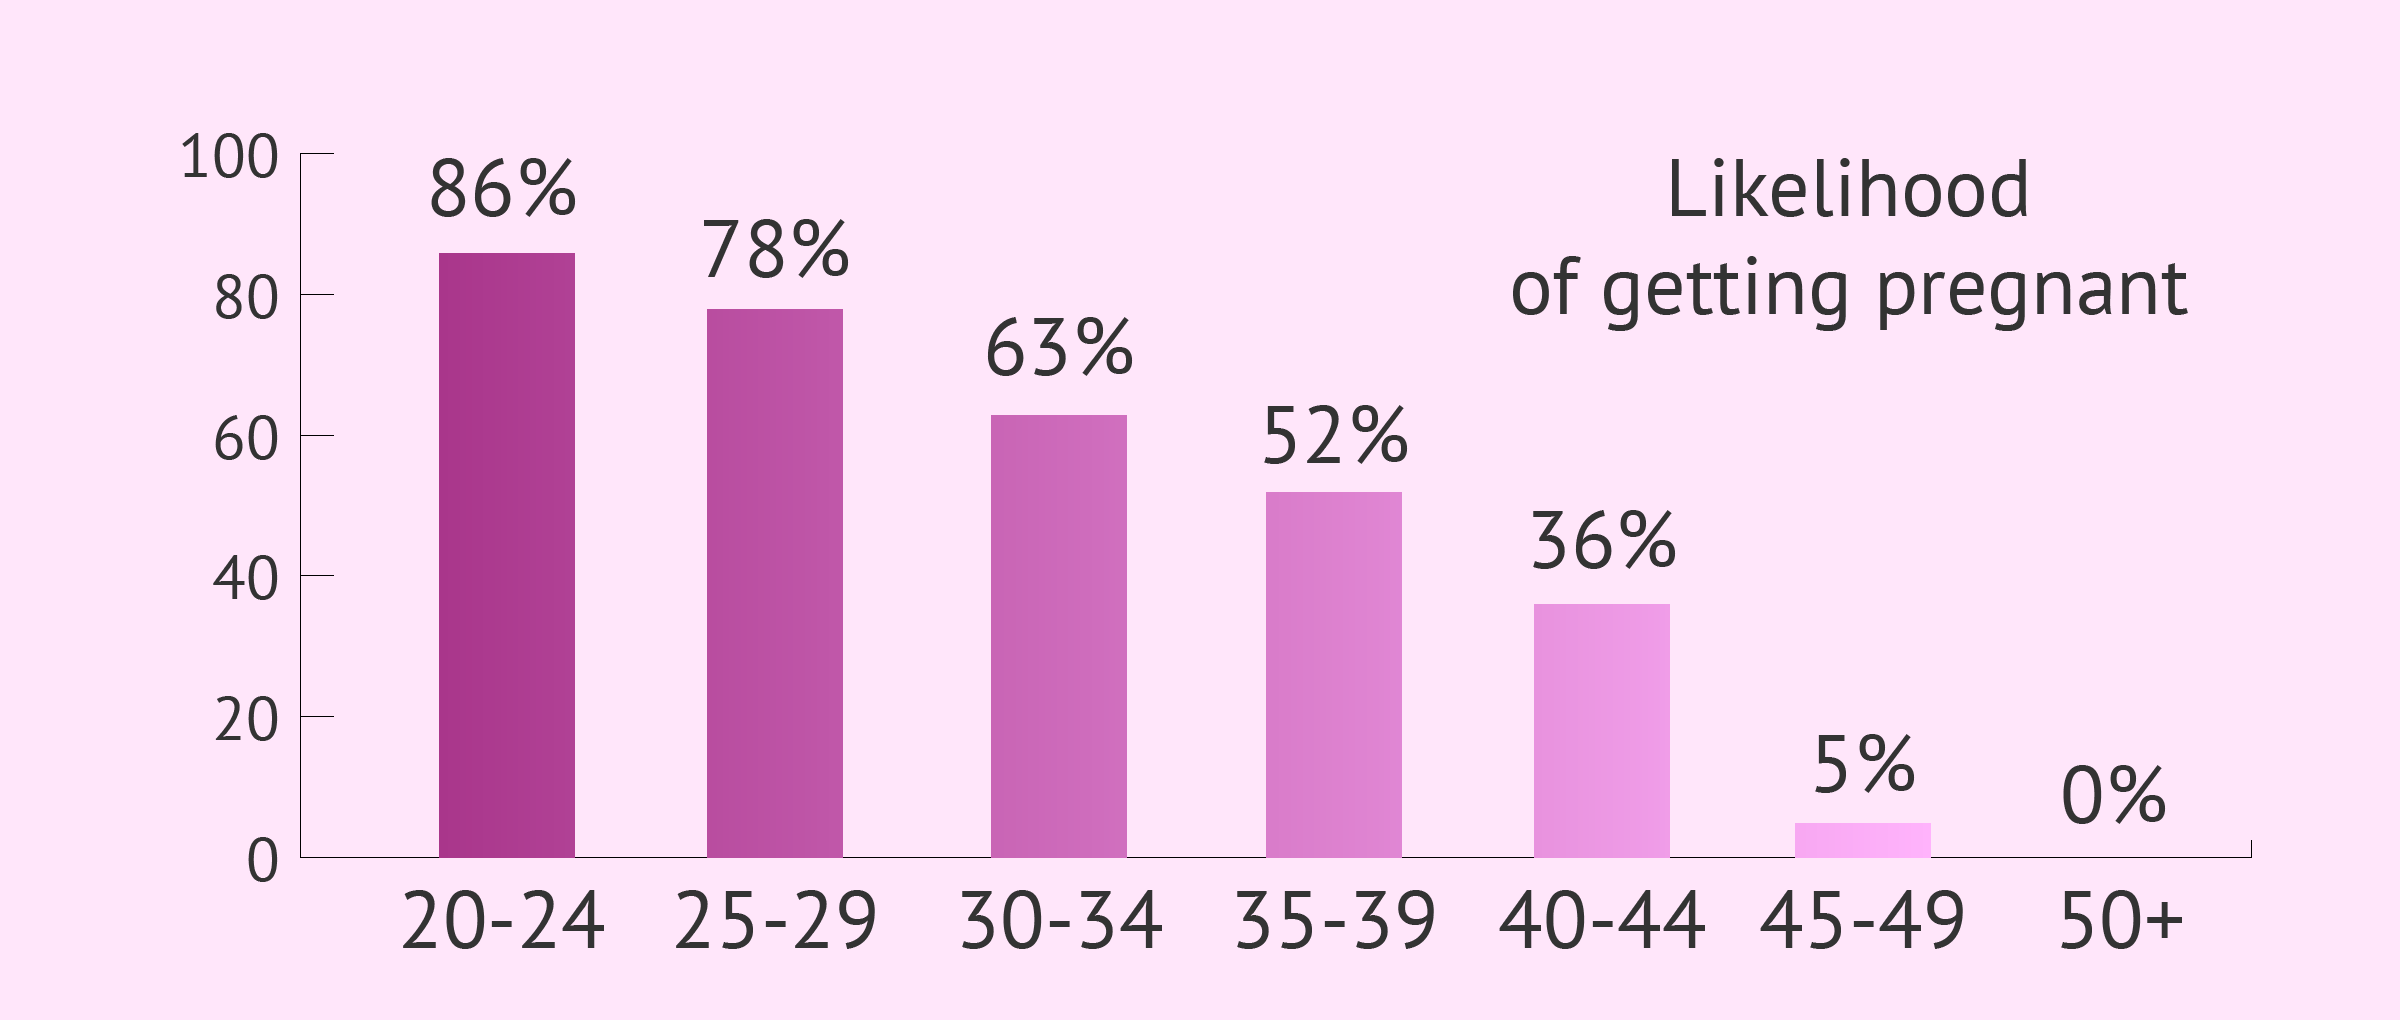
As one can see in the graph above, the likelihood of getting pregnant decreases as the woman ages. As one can see, the decline speeds up after 35.
Read the full article on: Female fertility: development of the female reproductive system ( 44).
By Marta Barranquero Gómez B.Sc., M.Sc. (embryologist), Paloma de la Fuente Vaquero M.D., Ph.D., M.Sc. (gynecologist), Zaira Salvador B.Sc., M.Sc. (embryologist) and Michelle Lorraine Embleton B.Sc. Ph.D. (biochemist).
Last Update: 06/29/2017
