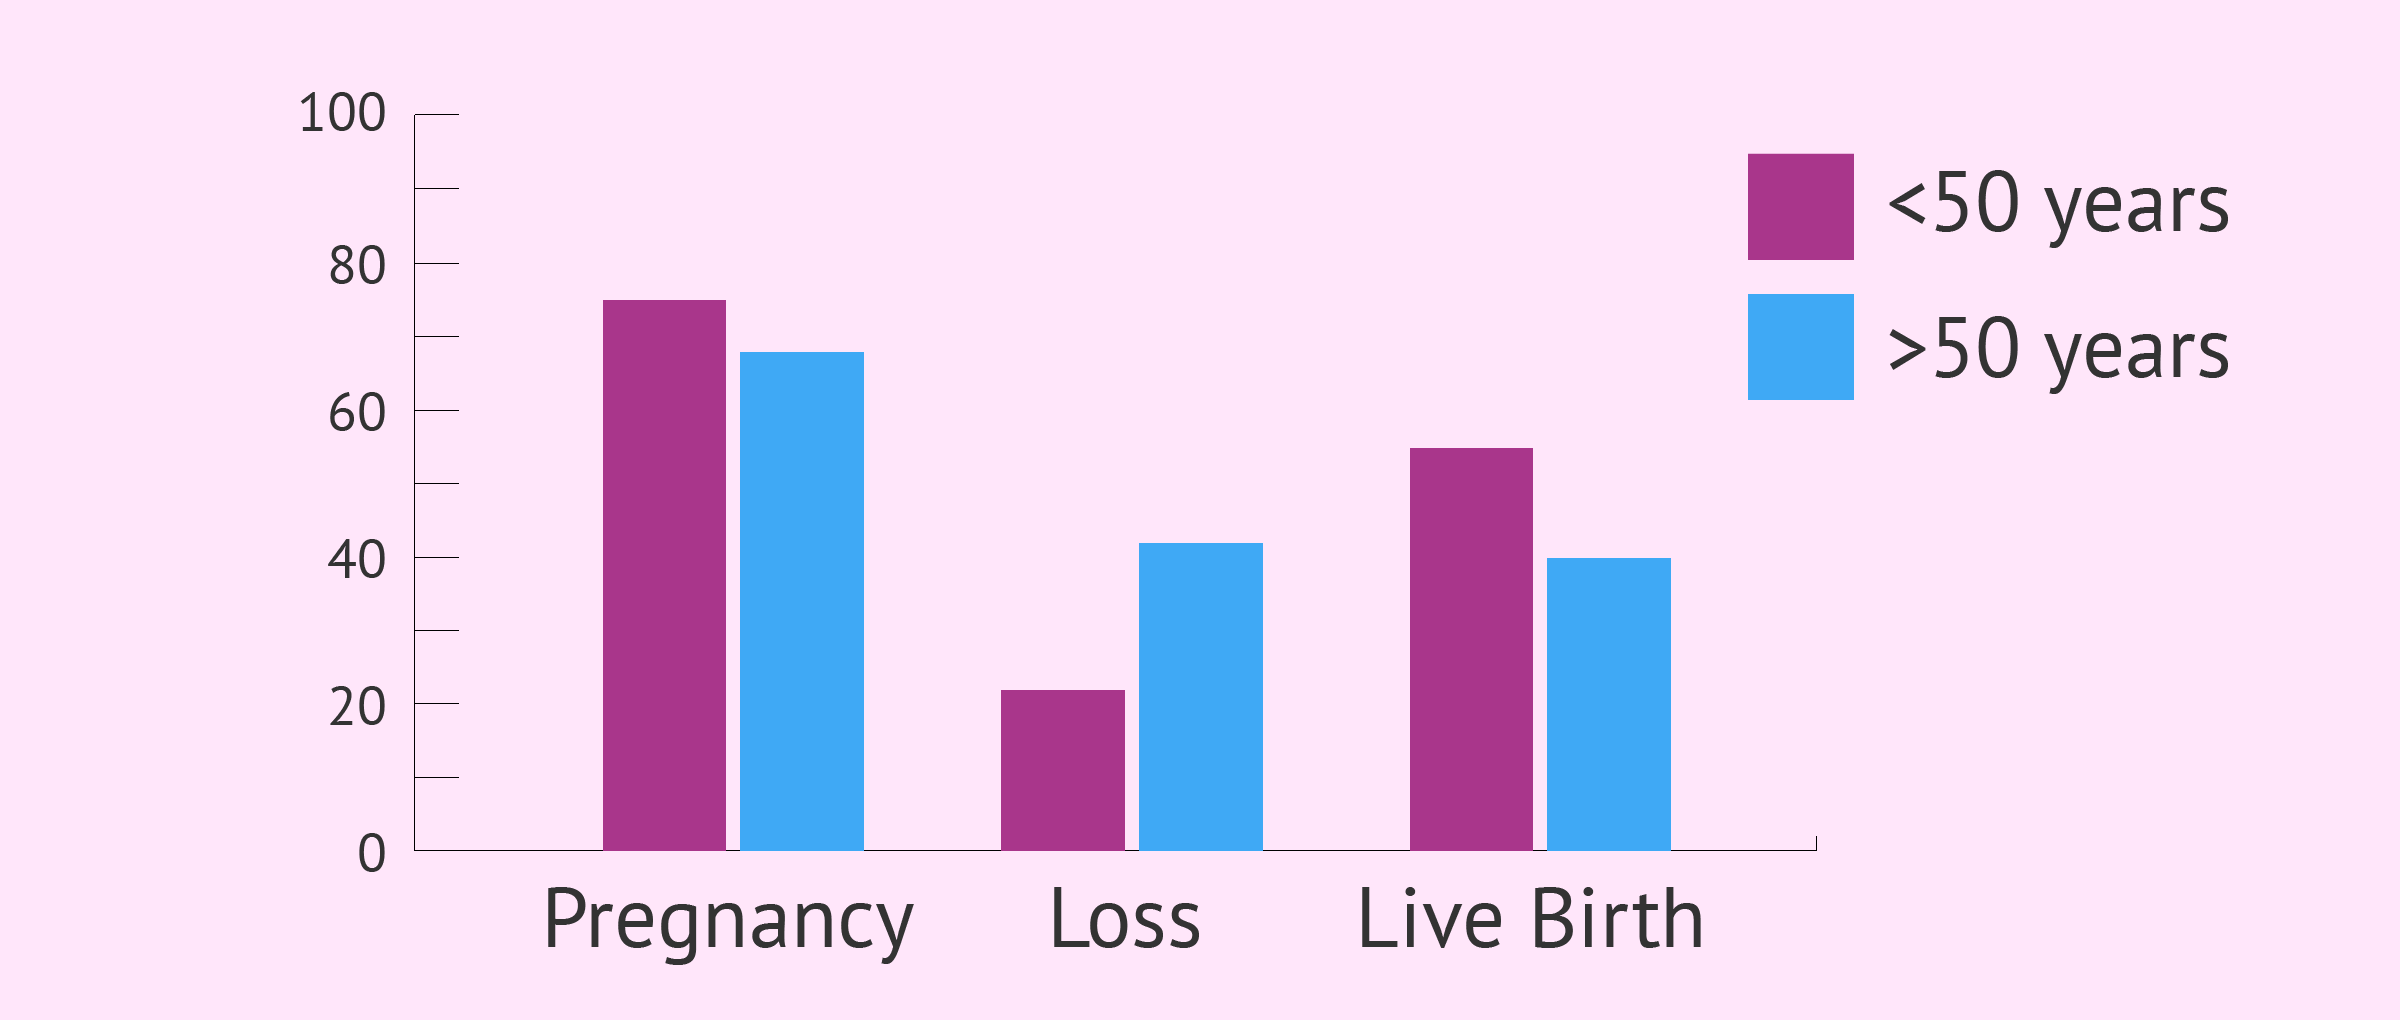
The graph below shows that age also has an impact on male fertility, although it is not usually as severe as in the case of women.
As a man ages, the sperm count, sperm motility, and the amount of normal sperm decrease progressively. Pregnancy and birth rates decline while the miscarriage rate increases when the age of the male partner is 50 or older.
Read the full article on: Male Fertility – Parts & Functions of the Male Reproductive System ( 35).
By Emilio Gómez Sánchez B.Sc., Ph.D. (senior embryologist), Jon Ander Agirregoikoa M.D. (gynecologist), Marta Barranquero Gómez B.Sc., M.Sc. (embryologist), Zaira Salvador B.Sc., M.Sc. (embryologist) and Michelle Lorraine Embleton B.Sc. Ph.D. (biochemist).
Last Update: 06/26/2017
